Understanding Stock Charts
Stock charts, fundamental to the practice of trading and investing, serve as vital visual tools that encapsulate a wealth of information regarding a stock’s historical performance. Through an examination of stock charts, individuals can glean insights into various aspects like trends, price movements, and potential future behavior. In exploring these charts, diverse types are available—line charts, bar charts, and candlestick charts each offering unique strengths and insights corresponding to specific trader needs.
Line Charts
As one of the most straightforward forms, line charts simplify the understanding of a stock’s trajectory over time. Predominantly, these charts focus on presenting the stock’s closing prices across a defined period. This unadorned representation renders them a useful tool for obtaining a quick snapshot of the stock’s general performance. However, they fall short when detailed intraday nuances and volatility information are required. Traders seeking only a fundamental understanding of how a stock has performed over time may find line charts sufficient.
Bar Charts
In contrast to the simplicity of line charts, bar charts provide a more detailed and inclusive overview of a stock’s price actions. Each bar is an encapsulation of the opening, closing, high, and low prices for the specified time segment. This multifaceted representation becomes instrumental for analysts endeavoring to dissect general trends and volatility in the stock market. While bar charts are indeed more complex, they offer essential insights to those seeking to understand market dynamics in more depth, including intraday price fluctuations.
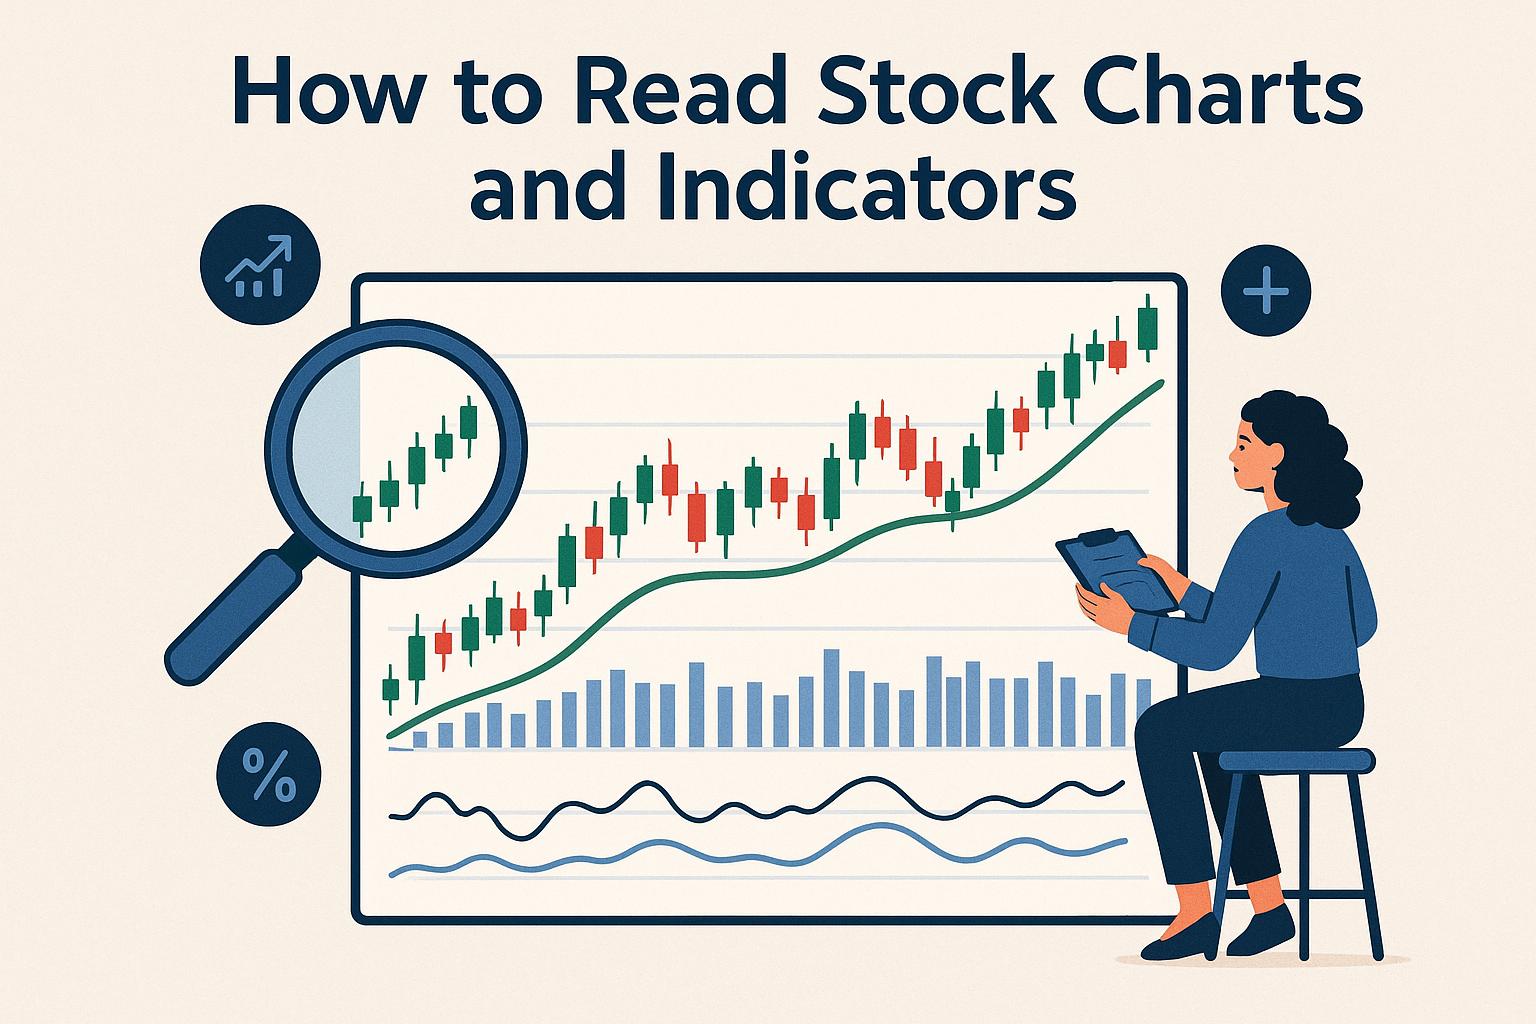
Candlestick Charts
The candlestick chart combines elements of both line and bar charts while adding a powerful visual aspect that enhances readability. Much like bar charts, they depict the opening, high, low, and closing prices but do so in a graphical format often more conducive to recognizing market patterns and trends. Central to the candlestick’s design are the body and wicks (or shadows), where the body indicates the price range between open and close, and the wicks extend to the high and low prices of the period. Such visualization aids traders in identifying significant market patterns swiftly and effectively.
Reading Candlestick Patterns
Unique patterns revealed through candlestick formulations can signal market trends categorized as either bullish or bearish. Take, for instance, the pattern known as the doji. Here, when the opening and closing prices align closely or identically, it frequently suggests market indecision. Understanding and recognizing such patterns are invaluable for traders aspiring to make more informed decisions by anticipating potential shifts in market sentiment before they occur.
Key Stock Indicators
Stock indicators operate on mathematical bases derived from stock prices and volume, offering predictive insights into future price movements and assisting traders in identifying viable trading opportunities. These indicators, when properly understood and applied, bolster decision-making processes with quantitative backing.
Moving Averages
Moving averages rank among the most prevalent tools used in smoothing out price data, thus laying bare trends over specified timeframes. The primary subcategories include the Simple Moving Average (SMA) and the Exponential Moving Average (EMA). An important distinction lies in that the EMA offers more sensitivity to current prices, thereby reacting more acutely to new information. This sensitivity makes it a favored choice among traders who prefer real-time data responsiveness.
Relative Strength Index (RSI)
The Relative Strength Index (RSI), an oscillator-based indicator, scales from 0 to 100 to assess the velocity and changes inherent in price movements. Market conditions may deem a stock overbought should its RSI breach 70, suggesting a potential downward correction, whereas a reading below 30 might indicate oversold conditions with prospects for a rebound. As a diagnostic tool, RSI helps find potential reversal points, aiding traders in strategizing entry and exit points.
Moving Average Convergence Divergence (MACD)
The Moving Average Convergence Divergence (MACD) is a sophisticated momentum-based indicator that reveals the relationship between two moving averages of a stock’s price. It encompasses the MACD line, the signal line, and the histogram—elements traders watch for crossovers which can flag potential buy or sell opportunities. The MACD’s nuanced approach to capturing market momentum makes it a staple in the toolbox of traders aiming to anticipate shifts and act accordingly.
Interpreting Chart Patterns
Within the realm of technical analysis, certain chart patterns are instrumental in projecting potential price paths. By understanding formations like the head and shoulders, double tops and bottoms, and flags and pennants, traders can interpret indications of market direction, whether suggesting reversals or continuations.
Head and Shoulders
The revered head and shoulders pattern essentially functions as a reversal indicator, heralding a potential transition from bullish to bearish trends. Conversely, the inverse head and shoulders configuration indicates a possible shift from bearish to bullish, offering traders insights into pending market movements and allowing them to prepare their strategic positioning accordingly.
Double Tops and Bottoms
Pattern recognition extends to double tops and bottoms, with both serving as reversal indicators. A double top signals a bearish reversal, suggesting that upward momentum has potentially reached its peak and a downturn may ensue. In contrast, a double bottom portends a bullish reversal, projecting that downward momentum is weakening and that prices may begin to ascend. Detecting these formations helps traders anticipate changes in market dynamics.
In summary, stock charts and technical indicators play an indispensable role in modern trading. They enable traders to grasp market trends and dynamics, armed with insights that facilitate strategic trade execution. Understanding these components is crucial, offering traders an advantage in timing their moves and recognizing market trends. For those passionate about expanding their trading knowledge, a wealth of online resources, including trading platforms and educational websites, provide further opportunities for deepening expertise in the intricate world of stock trading.
This article was last updated on: January 25, 2026